Xplore for Your Custom Program List Display
The Xplore feature is designed to allow you to manipulate the columns contained within each of the COGZ Preventive Maintenance Software lists. Using this feature, you have the options to change settings for your list displays and even export your data for added customization and graphing capabilities. Make use of these options to create the display that meets your specific facility maintenance management needs.
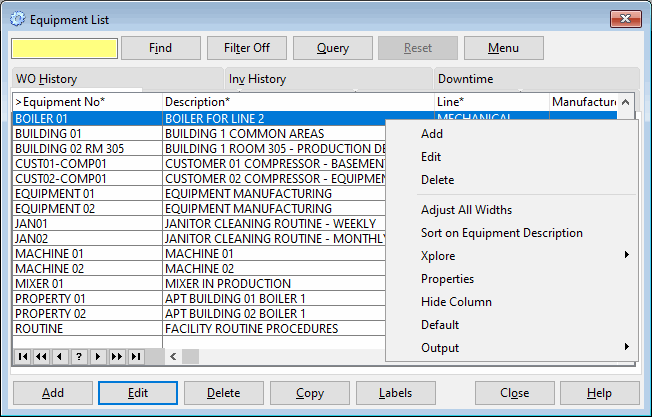
Customization to the list is saved for the next time you run COGZ Preventive Maintenance Software. Right clicking the mouse on the particular row or column of data that you wish to manipulate gives you access to this feature. You can also access this feature by clicking on the Menu button in each of your program lists. The Xplore functions can be used on any list found in COGZ. The menu below is the starting point where you can make your selection. Each option is explained below for your reference.
Adjust All Widths: This function adjusts the widths of all the columns in the list to fit the largest piece of data contained in each column, allowing you to view all of the text contained in each column more easily.
Sort on: The sort function sorts the data in accordance to the column that your mouse pointer is over. For example, if you are over work order description when you click on the sort function your data will be sorted alphabetically by work order description. You can also sort data by simply clicking on the column header. Using this method, your previous sort will be retained on browses.

A message will display to indicate that the previous sort has been saved on columns that are indexed. Click Don’t Show this again to disable this message.
Xplore: The Xplore function brings up a list of options. They all deal with rearranging data and column headers to allow for easier viewing. You can select an option from the list by clicking on the desired function and a check mark will appear on its left side.
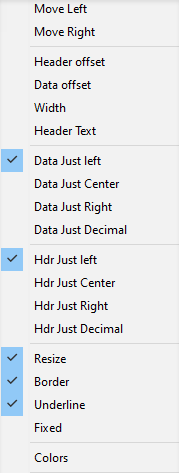
The major features accessed from this menu are the abilities to resize your lists, color code your data for faster identification, and arrange columns in an order that best suit your needs.
Properties: Allows you to customize the list you are currently viewing. The left-hand column shows you what can be displayed in your list. Any information that is currently displayed is listed in the right-hand column in the order in which it is displayed from top to bottom.
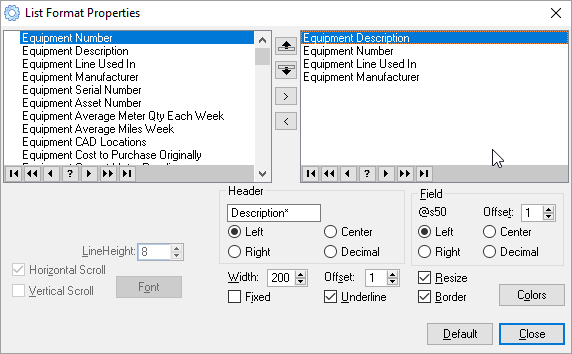
Use the bold up/down arrows to move your displayed columns by highlighting the column you wish to move. Using the up arrow will move your column to the left and using the down arrow will move your column to the right. You can also make these changes directly from your list by simply clicking and dragging the desired column to where you would like it to be in your list. This can be done one column at a time.
To add to your current display, you can simply select the desired information from the left-hand column and use the right-hand arrow to move it to your display. Using the up/down arrows, move the column to your desired location. If you no longer want a column displayed, highlight that column and use the left-hand arrow to remove the column.
Hide Column: Hides the column that your mouse is over. The column will disappear from the list view, but can be brought back at any time by using the default function from the Properties option in the Xplore menu.
Default: Brings the list in view back to its default form. This function will change everything that you have altered in the list back to its original format.
Output: Allows you to choose from several different options for the output of your data. This allows you to print your current list display or simply export it.
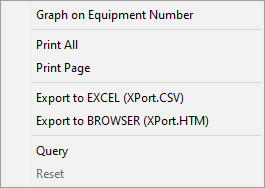
You may print your custom lists, graph, or export your data to a file or Excel using the Export to Excel option in the above menu.
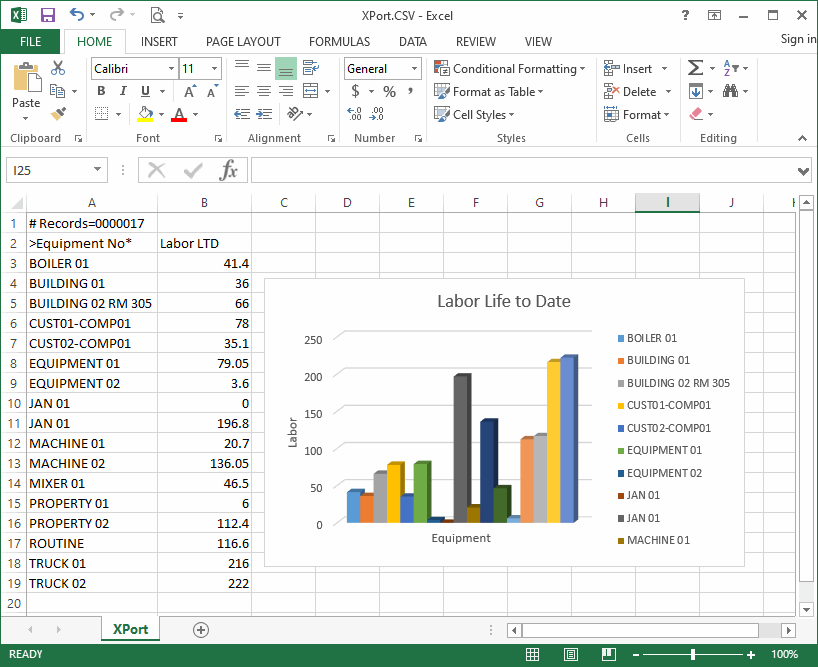
Exporting data to Excel is a powerful function that gives you the ability to manipulate your data any way you like and display data in charts or graphs.
